

Measuring AI citation rates with any real rigor means doing one thing every dashboard currently skips: expressing the result as a fraction, citations observed out of prompts asked, and attaching a confidence interval to it. A raw count or a bare percentage without that context amounts to a rumor with a number stapled to it.
Why raw citation counts mislead B2B content teams
The most common habit in AI visibility reporting is announcing a citation count, or sometimes a percentage, and calling it a result. That number can't be evaluated. It can't be compared to anything. And it definitely can't tell a content team what to do next.
A brand cited 12 times sounds like something. The same problem hits percentages: a figure like "we're cited in 40% of AI answers" is either rock-solid or pure noise depending on whether it came from a handful of prompts or a very large sample. Without the sample size, there's no way to know which.
Ranqo looked at over 100,000 prompt responses across more than 100 brands and found that brand visibility differs sharply by platform and by brand maturity. Without the denominator, the tier differences become a guess dressed up as a finding.
Even the research community hasn't settled on one number to chase. Zhang, He, and Yao's framework paper splits citation selection (whether a source gets picked up at all) from citation absorption (how much that source actually shapes the answer). Those are two different quantities, and a single headline number mashes them together, which leads a team to chase the wrong metric for a quarter.
What citation volatility does to any single-snapshot measurement
AI citation sources change so fast that a single measurement can only catch a moment, not a rate.
Multiple independent studies document this churn: what a model cited two weeks ago looks largely different from what it cites today. Ranqo's prompt study adds a sharper detail: sentiment, meaning whether an AI frames a brand positively or negatively, flips far more often than whether the brand gets mentioned. So even a citation that shows up reliably can show up with a different tone each time it's checked.
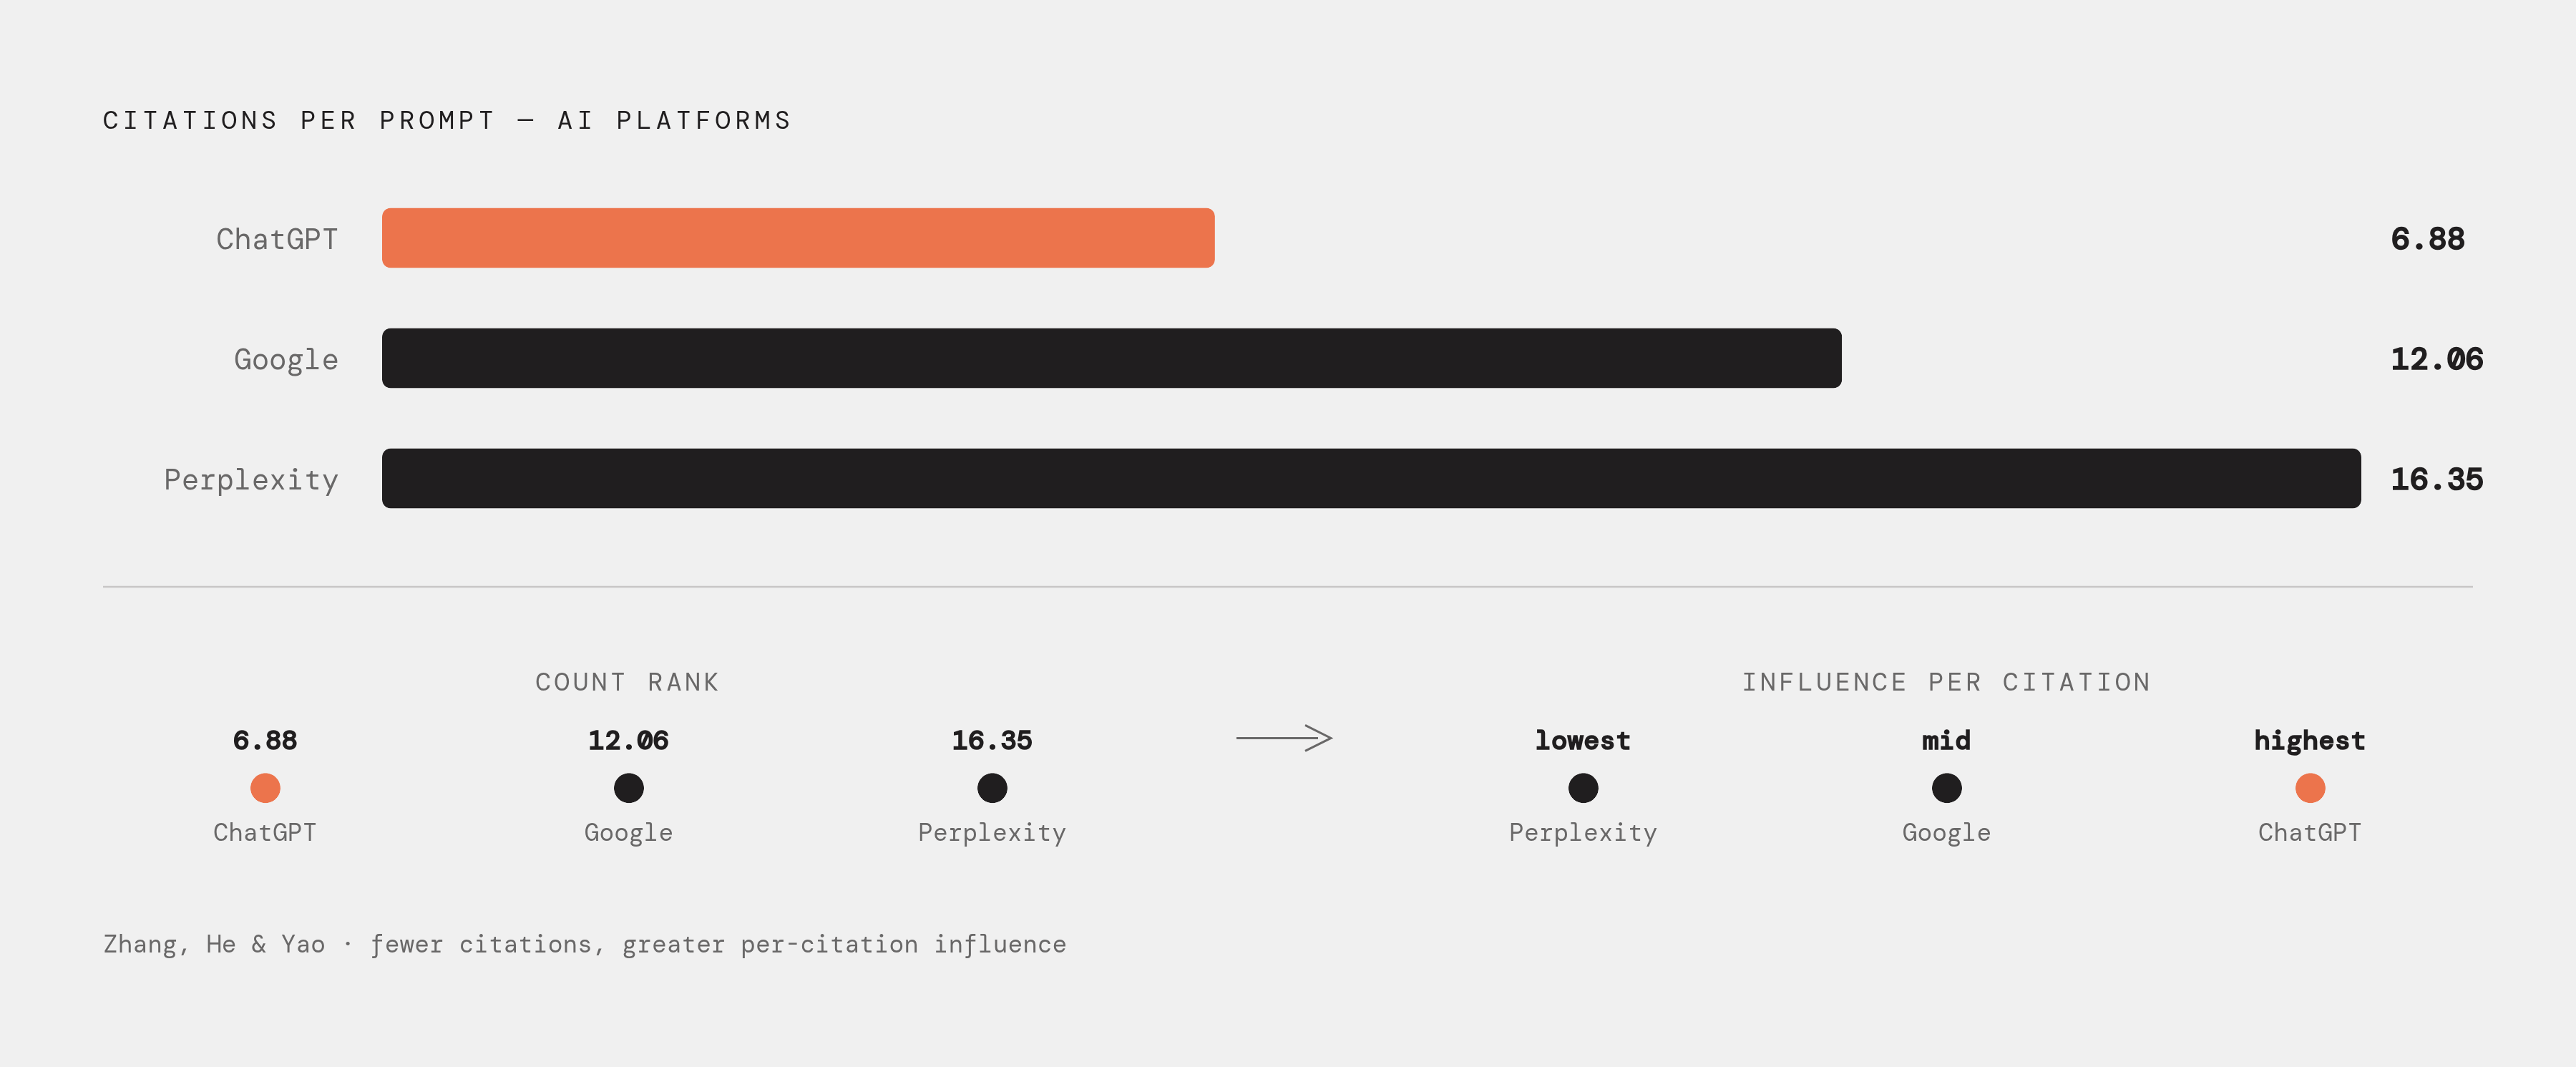
Platform divergence makes the instability structural. Zhang, He, and Yao measured average citations per prompt at 6.88 for ChatGPT, 12.06 for Google, and 16.35 for Perplexity. Three platforms, three different processes, and any measurement that blends them together is comparing apples to oranges to, somehow, a third fruit nobody asked for.
Schulte, Bleeker, and Kaufmann (2026) describe AI search visibility as a statistical distribution. A confidence interval on a sample of size one is infinite, which is a polite way of saying it isn't an interval.
Measuring citation selection and citation absorption separately
Treating "the brand got cited" and "the citation actually shaped the answer" as one outcome leads teams to optimize the wrong thing and misjudge which pages are doing real work.
Zhang, He, and Yao's two-stage framework names the split cleanly: citation selection is the platform choosing to search and picking a source, while citation absorption is that source actually contributing language, evidence, structure, or factual support to the final answer. These two numbers frequently move in opposite directions.
The data shows how sharp that gap gets. ChatGPT cites fewer sources per prompt than Perplexity, but the pages it fetches carry much more citation influence on average. If a team counts raw citations alone, it will rank ChatGPT as the weak channel, when ChatGPT may be doing the most useful work per citation of any platform tracked.
Tian, Chen, Tang, Liu, and Jia make the same point from the content side. Existing GEO methods tend to measure contribution, how much of a response traces back to a source, but the mechanism that actually sends traffic back to a creator is citation itself: the binary event of being named. Contribution without citation doesn't move a buyer anywhere.
Q&A formatting shows the trap in action. Zhang, He, and Yao found that Q&A pages average lower citation influence than non-Q&A pages do. If a team only tracks whether a citation happened, it won't see that result, because a Q&A page can get cited plenty while adding almost nothing to the answer's substance.
The fix is two separate fractions, not one score. Track citation presence (cited out of asks) and, separately for the pages that do get cited, an absorption or influence measure. Don't average them into a tidy composite number until the team actually understands what each one is telling them.
Building a valid hits-out-of-asks fraction
A citation rate only counts as valid measurement when every piece of it is stated out loud: the numerator, the denominator, the prompt panel, the engine scope, and the run protocol. If any one of those is left out, nobody can check the number against anything.
The numerator is citation events observed.
Zhang, He, and Yao show what full transparency looks like in practice: 602 controlled prompts, 21,143 valid search-layer citations, 23,745 citation-level feature records, and 18,151 successfully fetched pages.
Prompt panel design matters just as much as the math. Prompts need to stay fixed, cover commercially important topics, and reflect real buyer questions, not be hand-picked to raise the odds of a citation. A panel stacked with queries where the brand already shows up will inflate the rate and tell the team nothing true about its standing.
Run repetition isn't an optional extra. Running the same prompt several times on the same engine within the same window shows a team the actual distribution of outcomes. The resulting fraction, citations observed divided by prompt-engine-runs attempted, is the only version of this number a reader can check, a peer can reproduce, and a team can compare against its own future measurements.
Attaching a confidence interval to the fraction
If a citation rate has no confidence interval, it is a point estimate pretending to more precision than the data actually supports. The interval gives that fraction the evidentiary weight a bare point estimate cannot carry.
Citation presence is a binary outcome, cited or not, for each prompt-engine-run, which makes it a proportion. The natural tool for a proportion is a Wilson or Clopper-Pearson interval, and both can be calculated straight from the numerator and denominator with no extra data needed.
The interval does something useful right away: at small sample sizes, it comes out wide enough that most of the differences between a brand and its competitors turn out to be statistically indistinguishable.
Sample size requirements follow from the same logic. The confidence interval tells a team, honestly, whether its current panel is big enough to support the claim it wants to make.
Even a zero becomes informative once it has a denominator and an interval attached. A zero without a denominator could mean the brand was never asked about once, or it was asked about a thousand times and never showed up. Those are very different problems, and the bare number can't tell them apart.
Distinguishing a real authority gap from a broken tracking setup
A low or zero citation rate has two possible explanations: the brand genuinely isn't showing up in AI answers, or the measurement tool is failing to catch citations that are actually there. Confusing the two leads straight to the wrong fix.
Tian, Chen, Tang, Liu, and Jia lay out a taxonomy of failure points across the citation pipeline. A page can fail at fetching, due to malformed HTML or heavy JavaScript dependencies. It can fail at parsing, with content truncated or buried under boilerplate. All three appear identically in a dashboard as "not cited," but each one calls for a completely different response.
Fetching and parsing failures are tracking failures, not authority gaps. If the measurement tool can't retrieve a page in the first place, it logs a non-citation that reflects a broken crawler, not a judgment call made by an AI model.
The diagnostic test is simple enough to run by hand. Ask the live engine the same prompt, then check by hand if the brand's pages show up among the cited sources. If both agree the brand is consistently absent, the team has a real authority gap.
Letterbrace builds this distinction directly into how it reports results: a zero citation rate in the tracking system always comes with an explanation of whether it reflects a measurement gap or a genuine visibility gap. A broken tracker and a real content problem should never look the same on a report, because a team that can't tell them apart will spend its budget on the wrong fix every time.
How platform divergence forces a multi-engine measurement design
A citation rate measured on one platform won't generalize to another, because each platform draws from a different pool of sources and picks citations by its own logic.
Zhang, He, and Yao found that citation breadth differed sharply across the three platforms they studied. ChatGPT cites fewer sources, but it gives the ones it does cite noticeably more influence over the final answer.
Ranqo's study confirms the same divergence from a different angle, this time in source type.
The design consequence is direct: a hits-out-of-asks fraction has to be computed separately for each engine, never pooled together. Pooling blends structurally different citation processes into a single number that doesn't accurately describe any one of them.
Confidence intervals and citation stability over time
If a team tracks citation rates as fractions with confidence intervals over time, it can tell a real shift in AI visibility apart from ordinary run-to-run noise.
Ranqo's study notes that sentiment, meaning how the AI frames a brand, flips far more often than citation presence itself.
Continuous tracking with stated denominators also catches a different kind of event: a platform quietly changing how it indexes content. Comparing across brands is how a team tells those two apart.
The discipline that makes all of this work is simple.
Where citation fidelity fits into the measurement framework
Counting every citation event the same way overstates how much AI visibility is actually worth, because a meaningful share of citations misrepresent the source they're pointing to.
Tian, Chen, Tang, Liu, and Jia treat citation fidelity as its own measurement problem, separate from citation presence.
Ranqo's study found that sentiment, the tone an AI uses toward a brand, is the most volatile part of the whole citation picture, and it flips far more often than citation presence does. Sentiment volatility creates a fidelity problem sitting right next to a visibility problem: the brand shows up in the answer, but the answer might describe it inaccurately.
For a B2B content team, a citation that attaches the wrong capability, a feature that's been discontinued, or a competitor's claim to the brand is worse than no citation. It reaches a buyer who's already pre-qualified and deep into their research, delivering false information at exactly the moment that buyer is most ready to act on it.
Fidelity needs its own tracking line next to the citation fraction. For a sample of citation events, someone needs to check if the AI's claim about the brand actually matches what the cited page says. No tool currently automates that check at scale, but a periodic manual audit of a subset of citation events is well within reach for most teams.
Applying the framework: what a minimal viable measurement program looks like
A working measurement program built on this framework needs five concrete pieces: a fixed prompt panel, a stated run count, per-engine fractions with confidence intervals, a rule that every zero gets explained, and a longitudinal series tracked over time.
The prompt panel needs a set of commercially important prompts that reflect real buyer questions in the category, and it has to stay stable across measurement periods so the rates stay comparable. New prompts can get added later, but only with a clear versioning note, since swapping the panel silently breaks the whole time series.
Run count isn't a detail to skip. Each prompt needs to run multiple times per engine per period, and for a directional read, the confidence interval needs to be narrow enough to tell plausible presence apart from plausible absence. Rarer citation events need more runs to pin down precisely, so the right number depends on what rate the team is expecting to see.
Per-engine fractions get computed separately for each platform and reported as a vector, each with its own confidence interval, and they never get collapsed into a single average.
The zero-explanation rule means every zero or near-zero rate in a report comes with a diagnosis attached: a fetching failure, a parsing failure, or a genuine absence at the generation stage. A broken measurement and a real authority gap should never be allowed to look identical on paper.
The longitudinal series keeps every period's fraction and interval on record, so the team judges change by whether intervals overlap, not by whether the point estimate moved. If a new period's rate falls inside the prior period's interval, that isn't a real change, no matter how different the two numbers look side by side.
Letterbrace treats this measurement logic as a core output of its content work, not an afterthought bolted onto search reporting. Every tracked site gets a citation rate expressed as hits-out-of-asks with a confidence interval attached, and every zero gets explained before it reaches a client report. Ranqo's proposed v1.1 protocols for testing whether specific recommendations causally improve AI visibility point at the same standard: stated query volume, stated sample size, and reproducibility, the exact bar this framework sets for tracking a single brand over time.
A fraction paired with a confidence interval is the only form a citation measurement can take and still be checked by someone else, compared against a competitor, or acted on with any confidence. Everything short of that is a number with no way to know what it means.
